What the Chicago school ratings don't tell you
October 24, 2018

UPDATE: This post described the school ratings as they existed in 2018. Since the COVID-19 Pandemic, CPS has stopped using this system.
In the next few days, Chicago Public Schools will release its annual school quality ratings. Many parents look at the ratings primarily as a gauge of overall school quality, but it’s important to remember that the rating system was not built just for parents. According to the SQRP Handbook, the Illinois State Code “requires the CEO of the Chicago Public Schools to monitor the performance of each school. In doing so, the CEO is required to use criteria and a rating system established by the Board”.
The components that make a school Level 1+ vs Level 2+ may align with what you value for your child - or they may not. It’s helpful to understand what goes into the school rating - and more importantly, what does not - so you can make an informed decision.
What’s in a rating?
Most students enter the school system in Kindergarten, and so I’ll focus on the elementary schools. High schools use a different and more complex set of criteria, but the elementary ratings are pretty simple. They are based on three factors1:
- NWEA MAP assessment in Reading & Math (65%)
- Attendance rate (20%)
- Survey of parents, teachers, and middle school students (10%)2:
That’s it. The district assigns a point value to each component, adds them up, and then assigns a level based on the score. In 2017-18, about a third of the schools ended up with a Level 1+, another almost third were Level 1, and the remainder were Level 2+ or below. Schools at Level 2 or Level 3 are put on a special probation status and receive extra “help” (and oversight) from the district.
Attendance
Let’s start with everyone’s favorite category, attendance. Attendance rate counts all absences, with exception for the school’s two lowest attendance days of the year, and 8th graders after graduation. A perfect score is 96% attendance - which equates to an average of 7 days of absence per child during the year. A school with less than 92% attendance gets the lowest score, a 1 out 5 points for this section. Note that the school attendance rate counts excused and unexcused absences - sick days, religious holidays, vacations, doctor’s appointments, everything.
The attendance rate is very important to the overall level - it is weighted 20%, more than any other single indicator. This can have a significant effect on school ratings. For example, last year Saucedo Scholastic Academy just barely received a Level 2+ rating, with 2.9 points. Students at Saucedo had a 95.9% attendance rate. Had students been sick just a few days less, their attendance would have increased to 96.0%, and they would have become a Level 1 school.
During 2017-18 school year, about a third of elementary schools received a lower rating because of attendance. When you look at school levels, a large part of what you’re seeing is the attendance rate.
Does this align with your values as a parent? For me, I don’t care that much whether students attend my school at a 93.6% rate or a 95.1% rate – yet that gap can affect the score as much as a 40 percentile difference in Math! This is a great example of a component that is intended to drive behavior - get principals to increase attendance in their schools - but which is of limited value in parental selection.
There is an equity issue as well. Attendance is correlated with income. This means that schools with lower levels of income have a built-in penalty in the school ratings.
Academics
The most important category of the SQRP is, of course, the academic test scores. Most parents want to send their kid to a “good school” with high academic achievement. There are two ways of looking at academics:
- Attainment - how high do the students score on average. When people say, “that school has good test scores”, they typically are talking about attainment.
CPS measures these using the NWEA MAP assessment. The MAP is a computerized, nationally-normed assessment; it takes about an hour to complete each for reading and math. The test is taken every spring by 2nd to 8th grade students in CPS.
Based on the results, the school is assigned percentile in both attainment and growth. These numbers tell you how the school did compared to other schools across the country (according to the norms provided by NWEA in 2015). For example, students at an 80th percentile school did better than 80% of all schools in the sample.
Attainment counts for 15% of the total score.
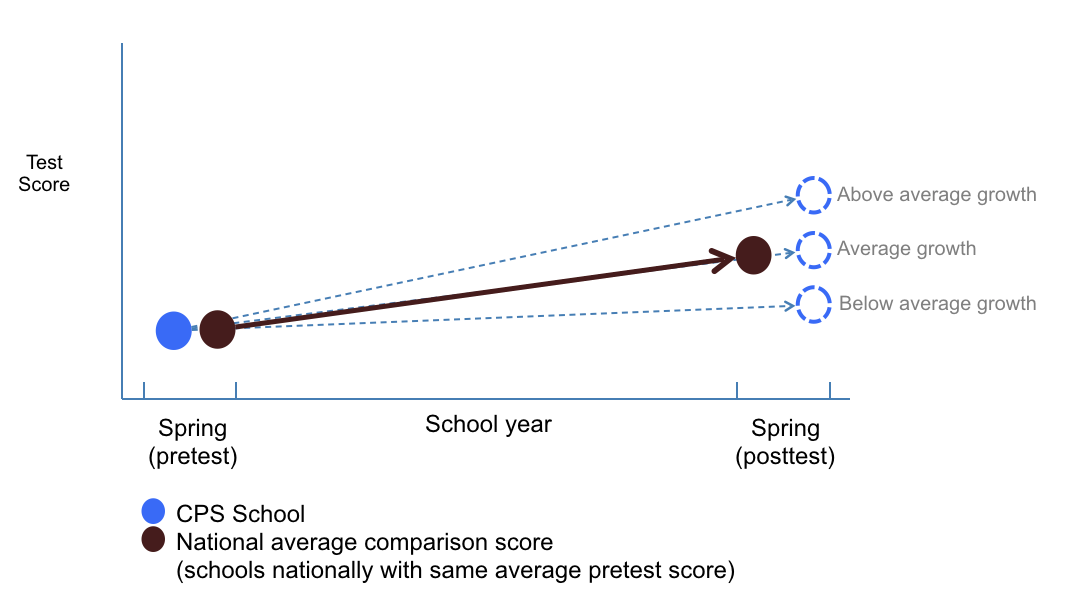
- Growth - how much improvement do students make year over year. Growth is more indicative of the learning that happened during the school year and is less influenced by factors like income & race.
The most important element of the school rating is the progress students made from one year to the next on the NWEA MAP. This is represented mostly by the “School Growth Percentile”. Similar to “School Attainment Percentile”, it represents how the school compares to all others nationally that started at the same level of school attainment. So a school at 25th Attainment Percentile but with 75th School Growth Percentile had higher average growth than 75% of all ther schools that started at the 25th Attainment Percentile. Practically, this means that “great” schools need to do better than other “great” schools to maintain their growth ratings.
Growth counts much more than attainment - a full 50% of the total score (See the full table below for details on the score components).
School Organization
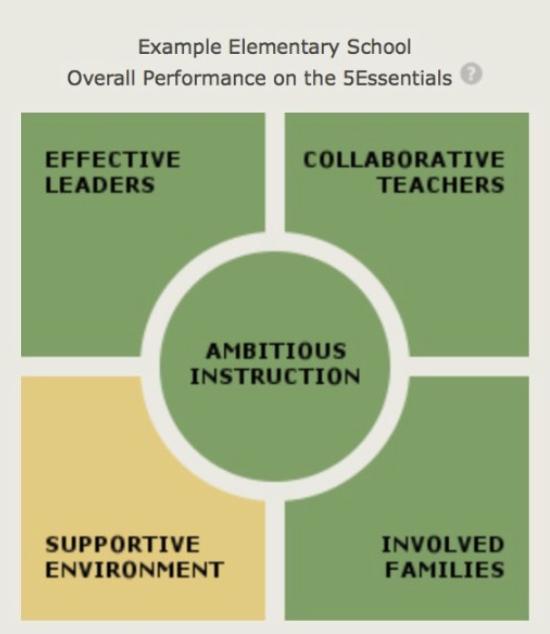
Finally, each school takes a survey to measure overall school culture. The 5 Essentials Survey is developed by UChicago Impact to gauge climate and culture in the building. Surveys are submitted by parents, teachers, and students 6th grade and up; the questions are aggregated to tease out a score along five “essential” dimensions: instruction, leadership, teachers, families, and facilities.
With a 10% weight, the survey has a moderate impact. In 2017, more than 75 schools dropped at least one rating because of the results of the survey.
What is not measured?
So we now know that the score captures academic growth & attainment on the MAP test, as well as attendance rate and the response to a survey. What does it miss that may be important to parents?
Kindergarten to 2nd grade instruction
3rd - 8th grade only makes up 60% of the overall SQRP. 2nd grade attainment does count for 5%, but K-1 are not measured at all. This means that a third of the instruction in a K-8 building is not factored into the school rating. For a parent applying to Kindergarten this fall, the first few years of instruction are not captured at all in the rating.
Anything other than Reading and Math
The NWEA does not capture Writing, Science, Social Studies, Art, Music, Dance, Drama, P.E., Social-Emotional growth, Creative Thinking, or any other category of learning outside of core reading and math. While Reading and Math progress are absolutely crucial to student success, parents may be interested in schools that also provide other academics, which are not included in the rating.
Teacher-administered tests
NWEA is a single test, administered by a computer. The NWEA MAP is generally a good assessment - it is used across the country by many innovative districts and it is particularly good at tracking growth. Still, it’s only one point in time on a test that takes about an hour. Parents should ask the school how else they track progress, especially in early elementary - some schools use teacher-administered assessments like STEP, F&P BAS, DIBELS, or countless other benchmarks and assessments which may provide a more holistic view.
Diverse Learners / Special Education
Students with Individualized Education Plans (IEPs) are called Diverse Learners in CPS, and they are called out as a special Priority Group (see the specific ranking in footnotes). However – and here’s the catch – those students’ scores will only be included if they actually take the NWEA MAP. There are many reasons why a computerized standardized test may be inappropriate for a child with an IEP, and IEP teams can choose to opt out of the NWEA MAP. In that case, their academic progress does not count towards the score at all, which is worrying in a district facing state oversight for violations of special education law.
Trends over time
The SQRP reports exclusively on results from last year. The 2017-18 scores (which were reported in October 2017) were based on 2016-17 data, while the 2018-19 scores (which come out in the next few days) will be based on 2017-18 data. The majority of elementary schools changed their rating last year, and more than 80% of CPS elementary schools have changed their rating some time in the last four years.
Specific school culture
While the survey provides a nice general view, you may value different things. For example, especially at schools with very high test scores, you may want to ask about an over-emphasis on testing. You may want to look at the specific survey results for your school to see how it matches your values.
Do your own research
In the end, the choice of school is one that each parent needs to make for themselves. The school rating can be an important input, but it fails to capture many aspects that are likely important to you.
The rating is a great way to understand how students in 3rd grade and up performed on basic reading and math during the prior school year, and how frequently students are absent. It does not capture academics in K-2, or science, social studies, extra curriculars, or most of school culture, all of which are likely important factors in choosing a school. The scores are highly sensitive and change regularly for many schools year to year, which means that they are not an entirely reliable indicator of long term quality as well.
Hopefully this was helpful; I’ll be publishing a follow up with analysis once this year’s scores are out. Let me know via Twitter what you’d like to see and what you found helpful!
Footnotes
1: CPS SQRP Handbook. This is the set of metrics that applied to 2017-18, and will also apply to 2018-19 ratings.
2: The remaining 5% is determined by a “Data Quality Index” but in practice, none of the schools levels changed as a result of this score, so it isn’t a real factor.
3: These are the specific indicators and weights that comprise each score. If a school does not have at least 30 students in a given subgroup who took the test, then the overall school average is used in place.
Growth Indicators
Only apply 3rd to 8th grade.
| Subgroup | Grades | Subject | Indicator | Weight |
|---|---|---|---|---|
| All | Reading & Math | % Meeting Growth Norms | 10% | |
| All | Math | School Growth Percentile | 15% | |
| All | Reading | School Growth Percentile | 15% | |
| African-American | Math | School Growth Percentile | 1.25% | |
| African-American | Reading | School Growth Percentile | 1.25% | |
| Hispanic | Math | School Growth Percentile | 1.25% | |
| Hispanic | Reading | School Growth Percentile | 1.25% | |
| Diverse Learner | Math | School Growth Percentile | 1.25% | |
| Diverse Learner | Reading | School Growth Percentile | 1.25% | |
| English Language Learners | Math | School Growth Percentile | 1.25% | |
| English Language Learners | Reading | School Growth Percentile | 1.25% |
Attainment Indicators
| Grades | Subject | Indicator | Weight |
|---|---|---|---|
| 3rd-8th | Math | School Attainment Percentile | 5% |
| 3rd-8th | Reading | School Attainment Percentile | 5% |
| 2nd | Math | School Attainment Percentile | 2.5% |
| 2nd | Reading | School Attainment Percentile | 2.5% |